

OpenAI Codex for data analysis is where the autonomous coding agent delivers some of its highest ROI — data analysis is full of well-defined, boilerplate-heavy tasks (data cleaning, format conversion, statistical calculation, visualization generation) that are ideal for Codex automation. Data analysts using Codex report building analysis pipelines 3-5x faster, spending more time on insight interpretation and less on code writing. This guide covers the data analysis workflows where Codex accelerates most.
OpenAI Codex in 2026 has grown to 4 million weekly active developers following the GPT-5.5 upgrade in April 2026 — OpenAI’s first fully retrained base model since GPT-4.5, built with explicit agentic-first training. Codex is bundled into ChatGPT Plus ($20/month), Pro ($200/month), Business, Edu, and Enterprise plans with no separate pricing. Three access modes: CLI (npm install -g @openai/codex), VS Code extension, and cloud delegation through ChatGPT with GitHub integration. Tasks run in isolated cloud sandboxes for 1-30 minutes depending on complexity. Multiple tasks can run in parallel — the “assign work and walk away” model that distinguishes Codex from earlier AI coding tools. OpenAI built the Sora Android app in 28 days with a 4-person team using Codex, the most-cited enterprise case study for agentic coding ROI. More than 10,000 NVIDIA employees across engineering and non-engineering functions have access to Codex, signaling that AI coding agents have moved beyond developer-only tools.
Data Analysis Tasks Codex Handles Best
Data Cleaning and Processing
Task: “Build a Python script to clean and standardize this dataset: [DESCRIBE COLUMNS AND ISSUES: duplicates, inconsistent date formats, mixed case text, missing values]. Specific cleaning rules: remove rows where [CONDITION], standardize dates to YYYY-MM-DD, title-case all name fields, fill missing [COLUMN] with [METHOD: median/mode/0], flag rows where [VALIDATION RULE] is violated without removing them. Output: clean CSV + cleaning report showing counts for each operation.”
Automated ETL Pipeline
Task: “Build a Python ETL script that: (1) Extracts data from [SOURCE: CSV folder / API endpoint / database connection string], (2) Transforms by [LIST TRANSFORMATIONS: join tables on X, calculate derived columns Y and Z, filter to records where condition A], (3) Loads to [DESTINATION: SQLite / PostgreSQL / output CSV]. Add error handling, logging to a log file, and email alert if any step fails. Run daily at 6am.”
Statistical Analysis Scripts
Task: “Build a Python script that performs A/B test analysis on this dataset [DESCRIBE: two groups, conversion metric]. Calculate: conversion rates per group, statistical significance (chi-square test), p-value, 95% confidence intervals, minimum detectable effect, and sample size adequacy check. Output a formatted report as both terminal text and HTML that I can send to stakeholders. Assume I’m not a statistician — explain each metric in plain language in the report.”
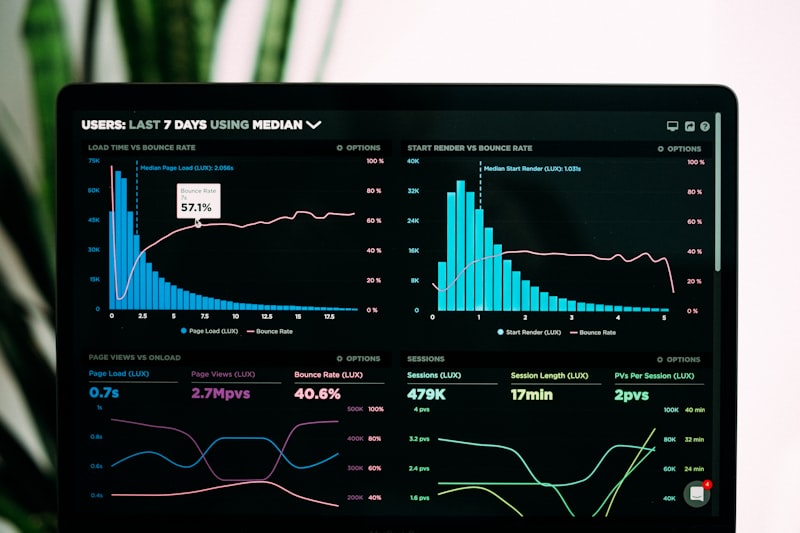
Visualization Dashboards
Task: “Build a Python Plotly Dash dashboard that reads our sales CSV [date, product, region, revenue, units, channel]. Charts to include: revenue trend (line, last 12 months), top 10 products by revenue (horizontal bar), revenue by region (choropleth map if possible, else bar), channel mix over time (stacked area), and a filters panel for date range, region, and channel. Deploy locally. Make it look professional with dark theme.”
Automated Report Generation
Task: “Build a Python script that reads our weekly data CSV, runs these analyses: [LIST YOUR ANALYSES], generates a PDF report using ReportLab with: executive summary table, 3 charts (using matplotlib), key insights section (text I’ll template), and data source footer. Email the PDF to [LIST] every Monday at 8am. Schedule to run even if I’m not logged in.”
| Analysis Type | Codex Handles | Human Analyst Adds | Time Saved |
|---|---|---|---|
| Data cleaning | All cleaning code | Rule specification | 60-80% |
| ETL pipeline | Complete pipeline code | Source/dest specs | 70-85% |
| Statistical test | All calculations + code | Hypothesis and interpretation | 50-70% |
| Visualization | Complete dashboard code | Design preferences | 60-75% |
| Automated report | Template + scheduling code | Insight narrative | 55-70% |
For AI analytics tools that complement Codex, see our best AI analytics tools guide. For the full Codex overview, see our OpenAI Codex complete guide.
Key Takeaways
- Data cleaning and ETL scripts are ideal Codex tasks — well-defined, testable, boilerplate-heavy
- Describe data cleaning as explicit rules: Codex applies every rule consistently without fatigue
- Statistical analysis scripts: Codex handles calculation code, analyst handles hypothesis and interpretation
- Plotly Dash dashboards take 60-90 minutes with Codex vs days of manual build
Related: OpenAI Codex Complete Guide 2026 | Best AI Analytics Tools 2026 | Best AI Coding Tools 2026
Authoritative source: OpenAI Codex Official provides official Codex documentation on sandbox Python execution, package availability, and the reinforcement learning training on real coding tasks that makes Codex effective for data engineering workflows.